 |
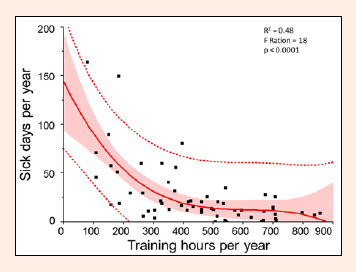
Figure 2.
A third-degree polynomial bivariate fit (solid line) of Sick days per year (y-axis) and Training hours per year (x-axis) shows a significant (R2 = 0.48, F Ratio = 18, p < 0.0001, N = 61 training years from 11 subjects) decrease in the number of sick days reported as the number of hours of training increases. The shaded area indicates the 95% CI of the model and the dashed lines indicate the 95% CI for the individual data points.