 |
Figure 1.
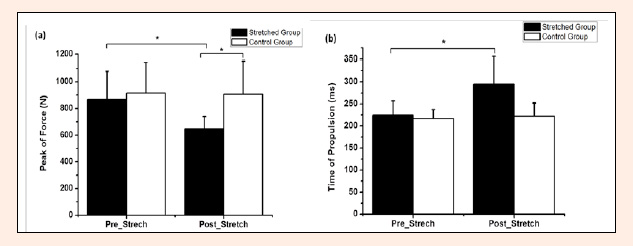
Mean and standard deviation of the (a) peak of force and (b) time of propulsion before and after static stretching (SS) for both groups stretched and control. * p < 0.05.
|
|
|
Figure 1.
Mean and standard deviation of the (a) peak of force and (b) time of propulsion before and after static stretching (SS) for both groups stretched and control. * p < 0.05.
|