 |
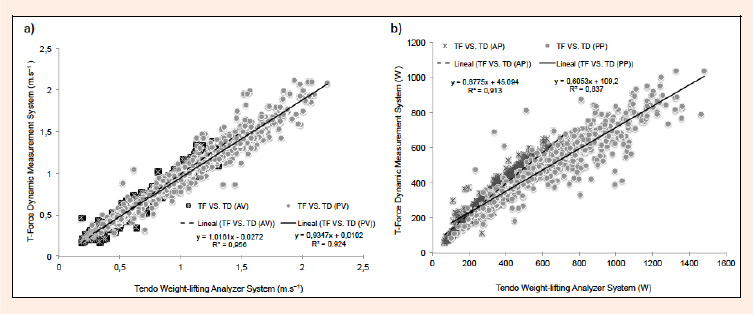
Figure 3.
Correlation between the Tendo Weight-lifting Analyzer System (TD) and T-Force Dynamic Measurement System (TF) velocity values. The graphs above shows a linear regression fit of both systems, with the corresponding regression equation. a) average velocity (AV) (doted line) and peak velocity (PV) (solid line). b) average power (AP) (doted line) and peak power (PP) (solid line) of both systems, with the corresponding associated regression equation.