 |
Figure 3.
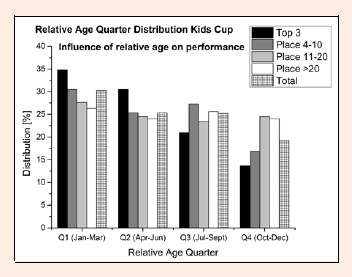
Relative age quartile distribution for the result-groups of the Kids Cup races – the influence of relative age on performance.
|
|
|
Figure 3.
Relative age quartile distribution for the result-groups of the Kids Cup races – the influence of relative age on performance.
|