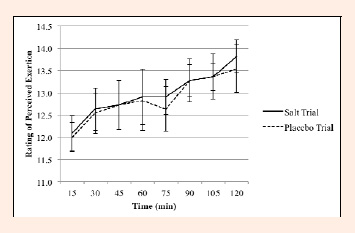
Figure 2.
Change in RPE during 2-hr bout of endurance exercise. Data are plotted as means ± SE.