 |
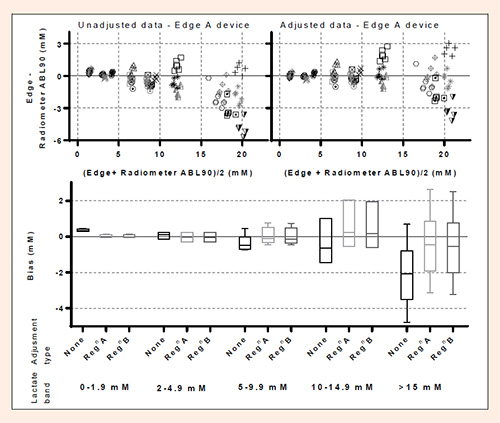
Figure 3.
Bland-Altman plots of repeated sample measurements of blood lactate for one of the Edge devices (Device B) before (left top panel) and after (right top panel) correction using the Edge data to predict the criterion (Radiometer ABL90) measurements (see Methods for details). The bottom panel contains box plots of the overall mean data within one of five bands of lactate concentration before and after bias correction on Edge analyser (Device B) using its own regression-corrected data (RegnB) or the regression correction from the second device (RegnA); boxes indicate the (lower and upper) quartiles and whiskers the ranges, while the lines within the boxes indicate medians.