 |
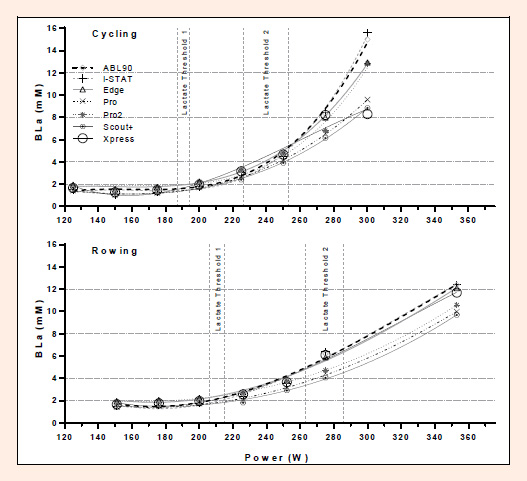
Figure 4.
Comparison of blood lactate (BLa) versus intensity curves for representative cycling and rowing data sets computed using ADAPT software (Australian Institute of Sport, 1995). The reference curve (3rd order polynomial) was established using the BLa values from the Radiometer ABL90 with zero bias. The remaining curves were generated using mean bias of the respective analysers for each concentration band (Table
7).