 |
Figure 1.
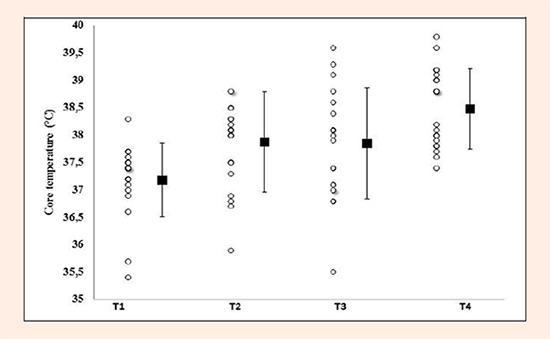
Individual and mean values (± SD) of core temperature at each stage of the race. T1: just before the race; T2: after the swim phase; T3: after the cycle phase; T4: at the end of the run phase
|
|
|
Figure 1.
Individual and mean values (± SD) of core temperature at each stage of the race. T1: just before the race; T2: after the swim phase; T3: after the cycle phase; T4: at the end of the run phase
|