 |
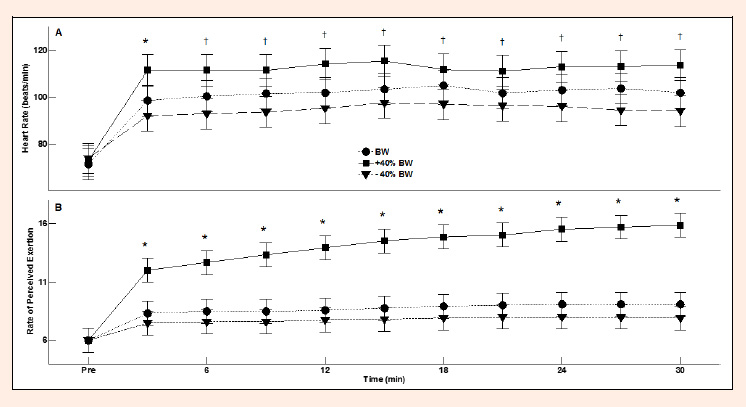
Figure 2.
Mean and 95% CI for heart rate (2A) and rate of perceived exertion (2B) for the 30-minute walk for each session. The asterisks indicate that values for the +40%BW session were significantly greater than for the BW and -40%BW sessions (p < 0.05). The cross symbols indicate significant differences between +40%BW and -40%BW sessions (p < 0.05).