 |
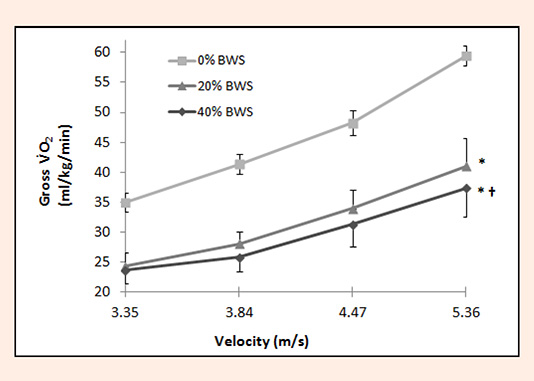
Figure 1.
Graph depicting the relationship between gross VO2 and velocity at each of the three levels of BWS. * indicates a significant difference in the relationship compared with the 0% BWS condition. *† indicates a significant difference in the relationship compared with both the 0% and 20% BWS conditions. At the 20% and 40% BWS conditions, standard deviation bars are shown in only one direction for clarity.