 |
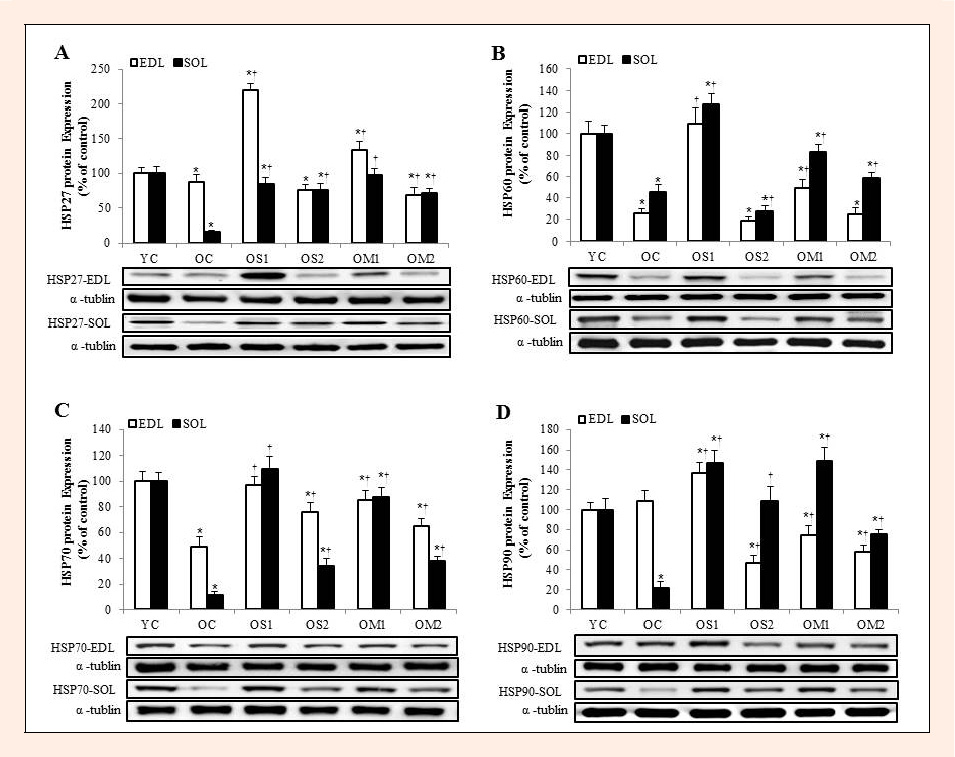
Figure 2.
The expression levels of HSP27 (A), HSP60 (B) HSP70 (C), and HSP90 (D) proteins in the extensor digitorumlongus (EDL) and soleus (SOL) muscles. Data are presented as percentage of mean YC values. Representative blots are shown. The symbols * indicates = significantly different from the YC group (p < 0.05). The symbol † indicates = significantly different from the OC group (p < 0.05).