 |
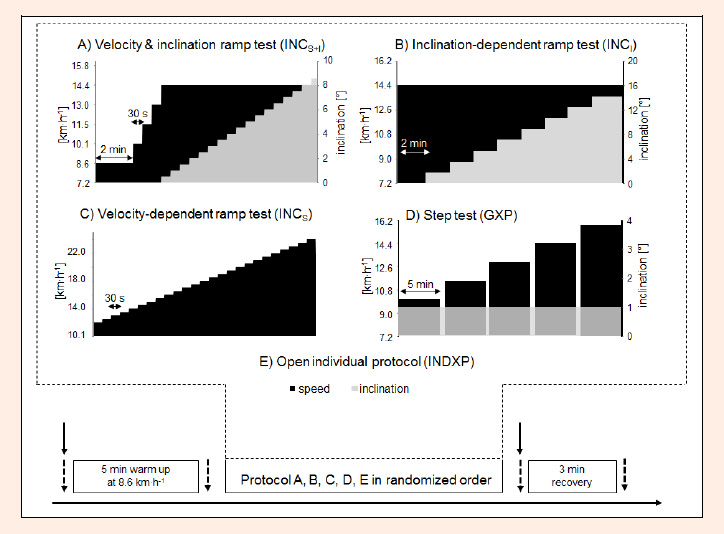
Figure 1.
The study design, including warm-up, the various protocols and cool down. The black areas represent changes in speed and the grey areas changes in inclination. The black arrows show the time when blood lactate samples were taken. The dashed arrows show the time when the participants were asked to rate their level of perceived exertion.