 |
Figure 2.
Bland-Altman plots with mean bias (solid black lines) and 95% limits of agreement (grey lines) for the differences in peak oxygen uptake between INDXP, INCS+I, INCI, INCS and GXP.
|
|
|
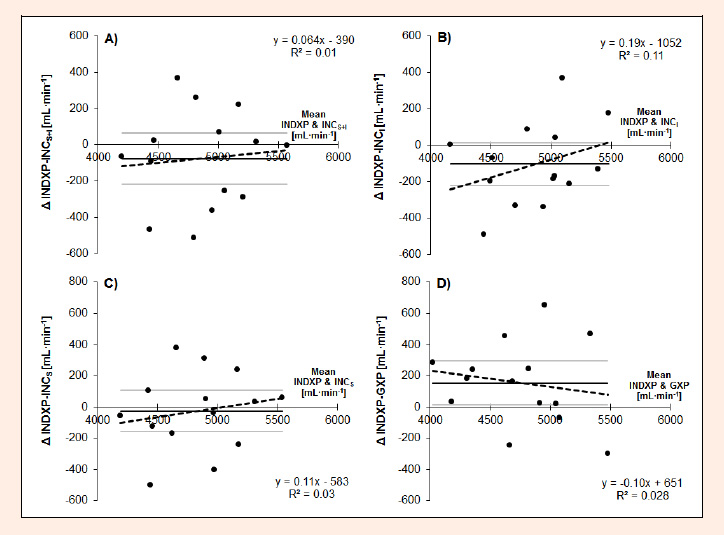
Figure 2.
Bland-Altman plots with mean bias (solid black lines) and 95% limits of agreement (grey lines) for the differences in peak oxygen uptake between INDXP, INCS+I, INCI, INCS and GXP.
|