 |
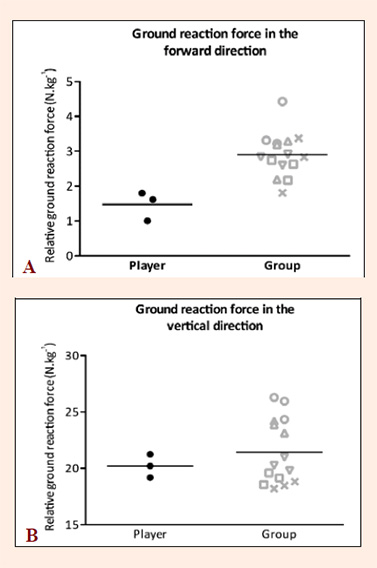
Figure 11.
Maximal ground reaction forces in the forward (A) and vertical (B) directions. Each plot represents one of the 3 best serves of a player. Each symbol represents a different player. We express means of player and group as relative force (N·Kg–1). Values for the player (n = 1; black) and the group (n = 5; grey).