 |
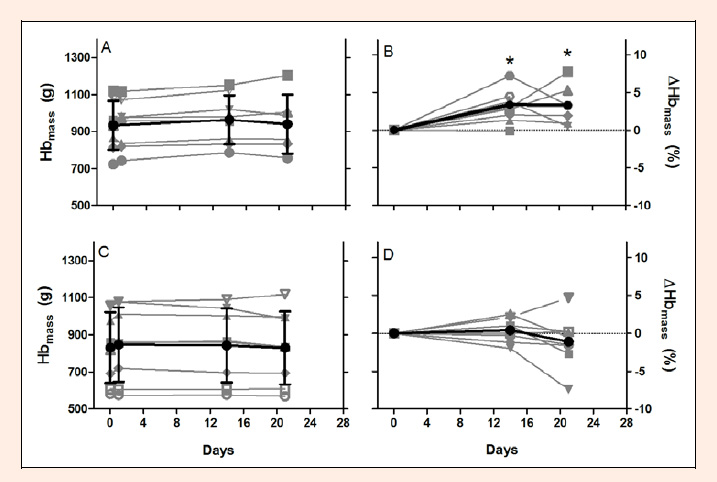
Figure 1.
Percentage change in Hbmass from baseline following three weeks of live high, train high (LHTH; A and C) altitude exposure or training and living near sea-level (600m; B and D) group. Mean and standard deviation shown in black, with individual data shown in grey. * p < 0.05, compared with CONTROL.