 |
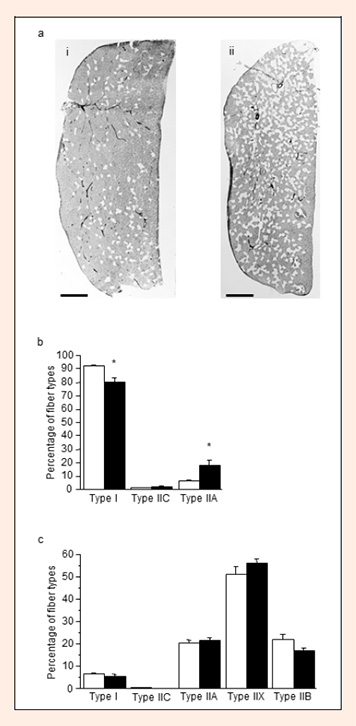
Figure 1.
Muscle fiber composition. (a) Representative transverse sections of soleus muscles stained with myosin ATPase preincubated at pH 4.3 from the control (i) and L-NAME-treated (ii) groups. Dark and light fibers are Types I and II, respectively. Scale bar, 500 µm. b and c, Percentages of the fiber types of soleus (b) and plantaris (c) muscles in the control (open columns) and L-NAME-treated (filled columns) groups. Values represent means ± SE; n = six to nine muscles per group. * P < 0.05 vs. control group.