 |
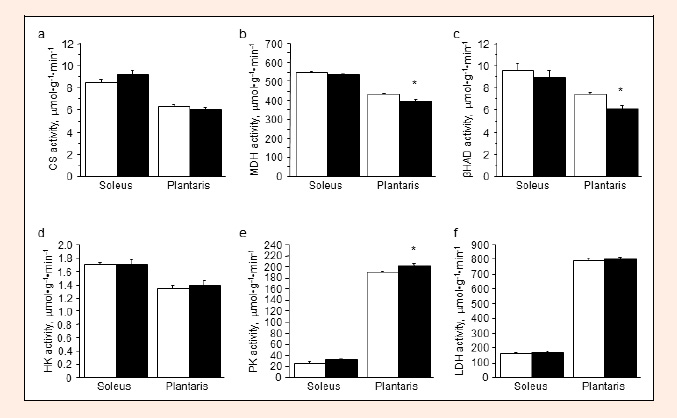
Figure 3.
Metabolic enzyme activity in the soleus and plantaris muscles: CS (a), MDH (b), βHAD (c), HK (d), PK (e) and LDH (f) in the control (open columns) and L-NAME-treated (filled columns) groups. Values represent means ± SE; n = 10 muscles per group. * P < 0.05 vs. control group.