 |
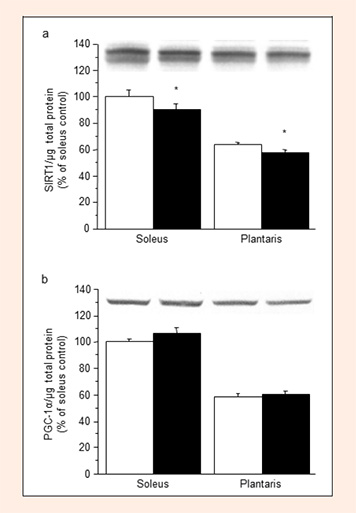
Figure 4.
Expression levels of SIRT1 (a) and PGC-1α (b) proteins in the soleus and plantaris muscles in the control (open columns) and L-NAME-treated (filled columns) groups. Values represent means ± SE; n = 10 muscles per group. * P < 0.05 vs. control group.