 |
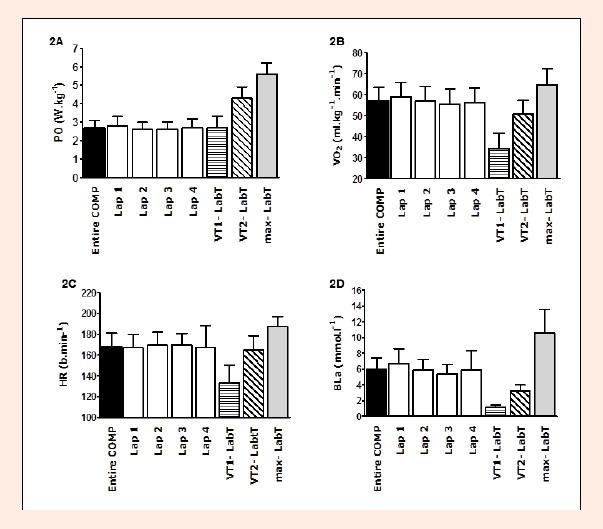
Figure 2.
PO (2A), VO2 (2B), HR (2C) and BLa (2D) during COMP. Values represent the mean of the entire COMP (2A-2C: average of 5 s; 2D: average of 4 laps) and for every lap. Values are related to variables of LabT (VT1, VT2, and max). Values are means ± SD for all subjects (n = 24).