 |
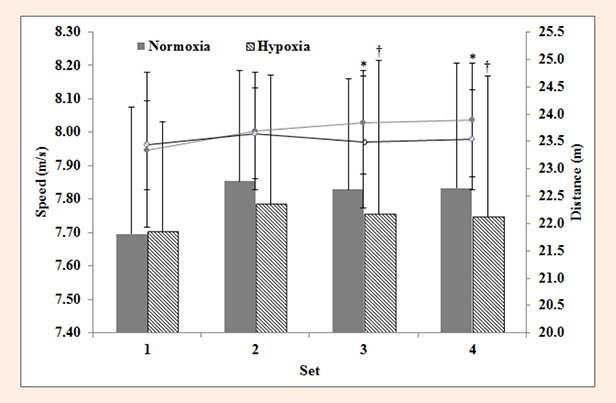
Figure 1.
Peak speed (bars) and distance (lines) values averaged across four, 4-s sprints for each set in normoxia and hypoxia achieved in male amateur team-sport athletes. * Distance covered during sprints greater in normoxic conditions (p < 0.05). † Different from normoxia (p < 0.05).