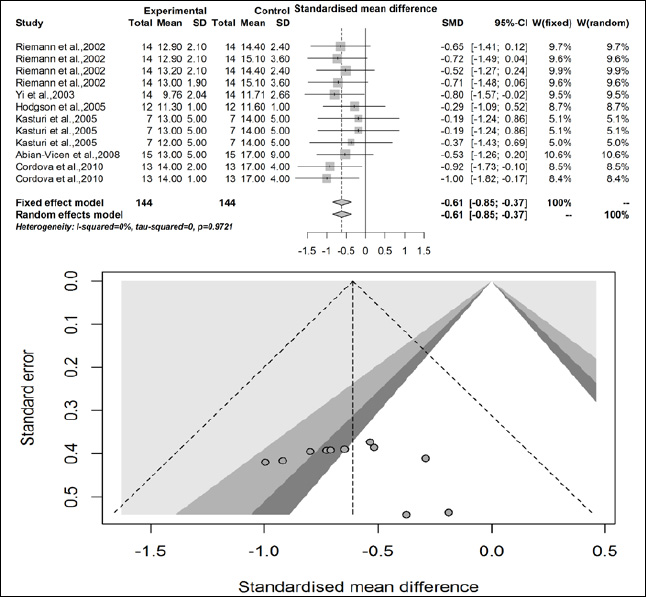
Figure 3.
Forest plot and contour funnel plot of the T1 outcome.