 |
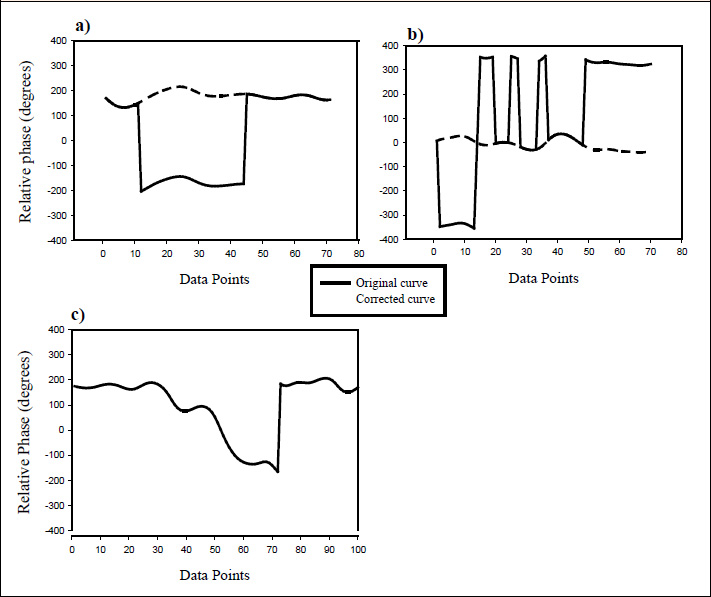
Figure 3.
Corrections to the continuous relative phase curves for phase shifts: a) where data trajectory is close to 180 º, b) when data trajectory is close to 0 º, and c) during a phase wrapping when no correction was made.
|
|
|
Figure 3.
Corrections to the continuous relative phase curves for phase shifts: a) where data trajectory is close to 180 º, b) when data trajectory is close to 0 º, and c) during a phase wrapping when no correction was made.
|