 |
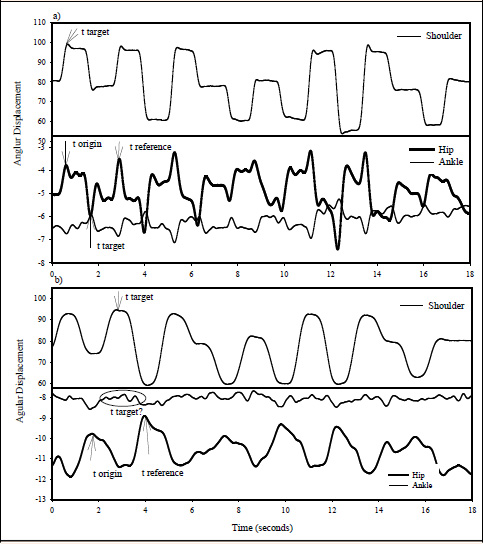
Figure 4.
Graphs of shoulder, hip and ankle angular displacement; a) in a participant using a serial arm movement pattern and b) a participant using a continuous arm movement pattern. Maximal points identify time (t) for origin and reference and target points used to calculate point-estimation relative phase.