 |
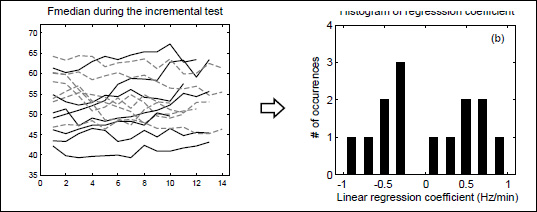
Figure 1.
(a) Lines representing the changes in median frequency (Fmedian) over the course of the incremental cycling test for 14 subjects. Black solid lines represent the subjects for which Fmedian showed an increasing trend during exercise, whereas grey dashed lines denote the subjects who showed a decreasing trend during the cycling workout. (b) Histograms of the linear regression coefficients obtained from the relations Fmedian vs time.