 |
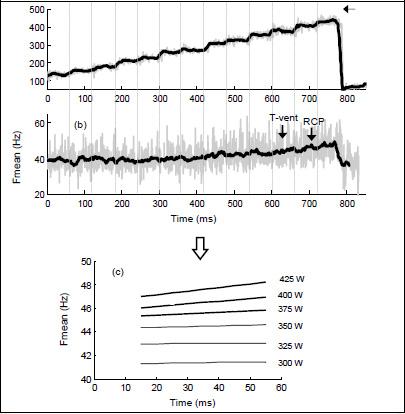
Figure 3.
Time plots of power output (a) and mean frequency (Fmean) (b) obtained in one cyclist from the vastus lateralis during the incremental test. Fmean increased slowly from the onset of the protocol until the end of the exercise. In (a) and (b) the black solid lines represent the power and Fmean averaged every 15 bursts. Arrows indicate occurrence of the ventilatory threshold (T-vent), and respiratory compensatory point (RCP). (c) Regression lines corresponding to the Fmean vs. time relation of each power output.