 |
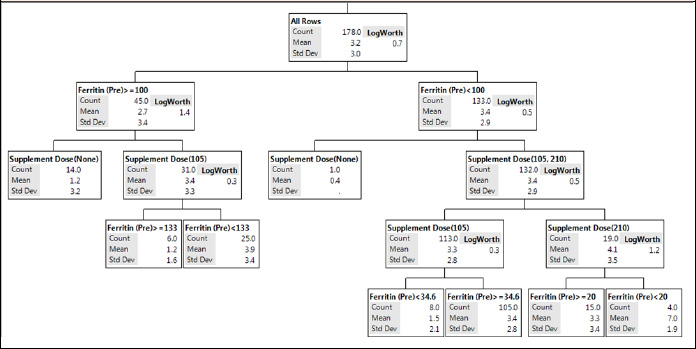
Figure 1.
Regression tree estimating the Hbmass response to altitude (%) based on athletes’ pre-altitude serum ferritin levels and their prescribed oral iron supplement dose during altitude exposure. Each parent node is split into child nodes based on the maximal Log Worth score [–log10 ( value)].