 |
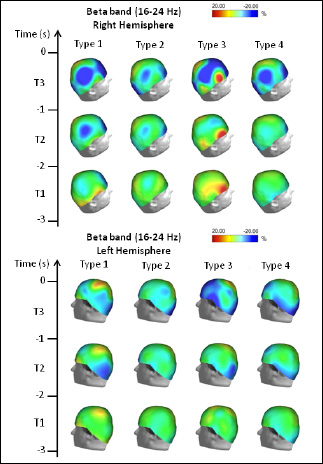
Figure 3.
Topographical distribution of the beta frequency ERD/ERS amplitude for each performance type. The beta ERD/ERS was mapped at three preshot periods with respect to zero time (i.e. shot release): T1, from -3 s to -2 s; T2, from -2 s to -1 s; and T3 from -1 s to zero time. Color scale: maximum ERD and ERS are coded in red and blue, respectively. The maximal (%) value of the ERD/ERS is given at the top of the maps.