 |
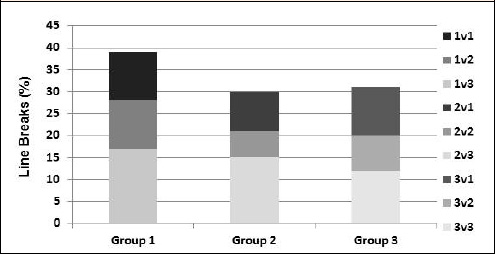
Figure 1.
Percentage of line breaks made by teams in each group. Different shadings represent the relative strength of the opposition the line break was made against. Teams were grouped based on their final log position; Group 1 represent teams finishing 1-5 on the log, Group 2 teams finishing 6-10 and Group 3 11-15.