 |
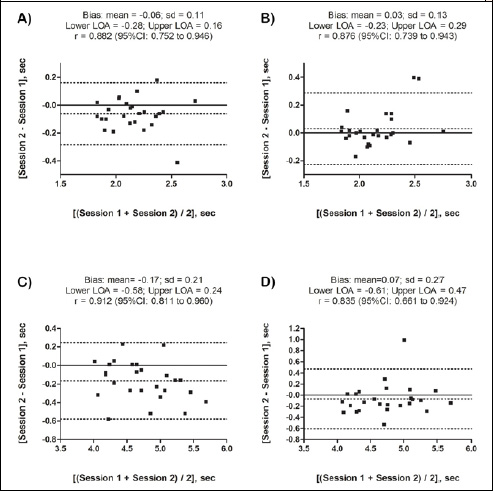
Figure 2.
Analysis of Bland-Altman plot of the goalkeeper-specific tests: panel A) S-Keeper right; B) S-Keeper left; C) LS-Keeper right; D) LS-Keeper left. Mean, standard deviation bias, upper and lower limits of agreement are also presented.