 |
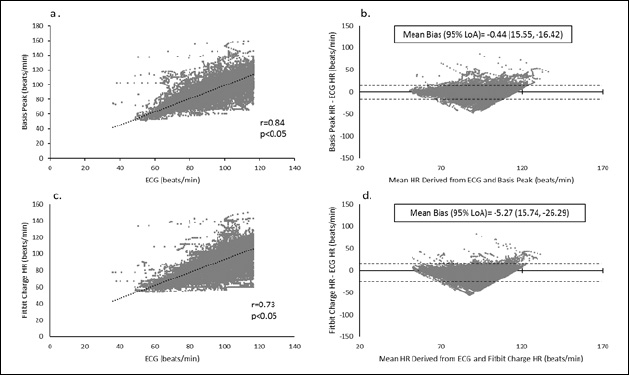
Figure 3.
Results for data set below mean ECG heart rate (<117 bpm) for Basis Peak (3a and 3b) and Fitbit Charge HR (3c and 3d). Correlation between each test device and ECG and Bland-Altman Plots indicating mean bias scores and 95% limits of agreement (LoA).