 |
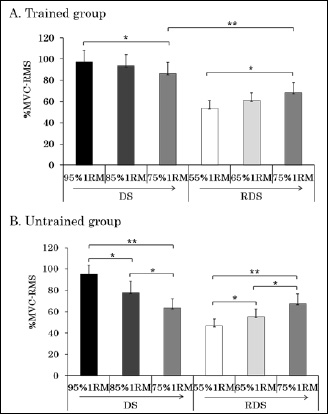
Figure 4.
%Maximal voluntary contraction (MVC)-Root mean square (RMS) values of the trained (A) and untrained (B) groups during the drop-set method (DS) and reverse drop-set (RDS) methods. Mean ± SD (n = 16 for each group) values are shown. *Significant difference (p <0.05). **Significant difference (p < 0.01)