 |
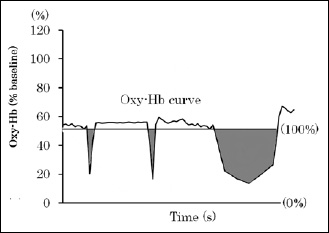
Figure 5.
Typical example of an area under the Oxy-Hb curve. The Oxy-Hb level observed at rest was defined 100%, and the minimum Oxy-Hb plateau level induced by arterial occlusion was defined as 0%. The mean Oxy-Hb level was calculated every five seconds during exercise. The area under the Oxy-Hb curve was obtained from the product of the time (sec) and the mean Oxy-Hb (%). The gray regions represent the area under the Oxy-Hb curve.