 |
Figure 6.
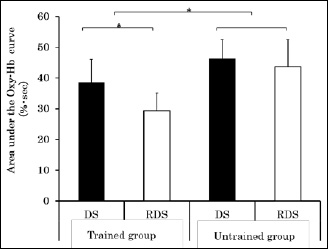
Area under the Oxy-Hb curve values of the trained and untrained groups during the drop-set (DS) and reverse drop-set (RDS) methods. Mean ± SD (n = 16 for each group) values are shown. *Significant difference (p <0.05)
|
|
|
Figure 6.
Area under the Oxy-Hb curve values of the trained and untrained groups during the drop-set (DS) and reverse drop-set (RDS) methods. Mean ± SD (n = 16 for each group) values are shown. *Significant difference (p <0.05)
|