 |
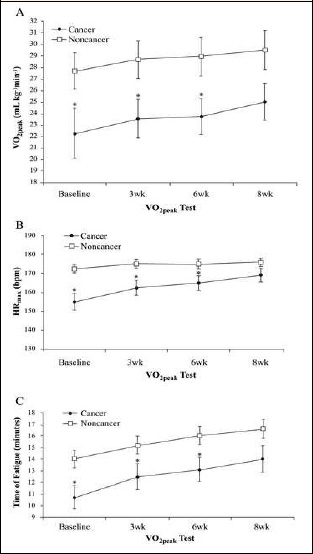
Figure 3.
Comparison between cancer survivors (black circles) and non-cancer participants (white squares) for VO2peak (A), HRmax (B), and TOF (C) responses at baseline, 3-wks, 6-wks, and 8-wks of aerobic training. *Significant differences between cancer survivors and non-cancer participants (p < 0.05). Values are means (±SEM).