 |
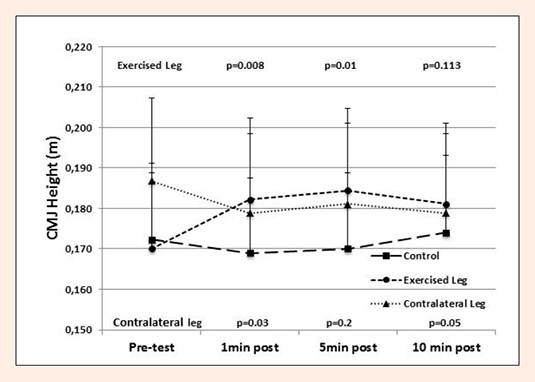
Figure 2.
Figure illustrates countermovement jump (CMJ) height (meters) changes with the exercised leg (circles), contralateral leg (triangles) and control (squares) condition at pre-intervention and 1, 5, and 10 min post-intervention. The p
values indicate significant (p≤0.05) or non-significant differences from pre-intervention results. Vertical bars represent standard deviation.