 |
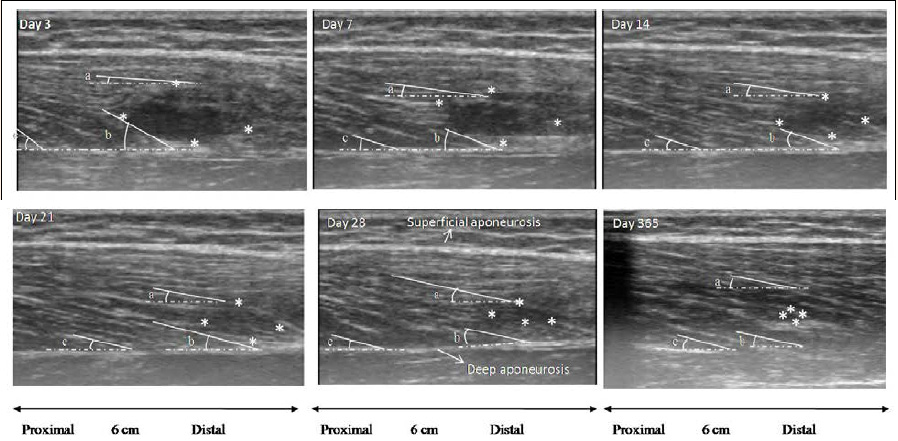
Figure 2.
Scar tissue image obtained at each measurement session until 1 year after acute injury. The hematoma / scar was defined by four markers (indicated as asterisks). The pennation angles formed between a superficial (a), a deep (b) and a typical (c) fascicle and the deep aponeurosis are illustrated in each ultrasound image (Please note that the illustrated markers and lines identified in this image may slightly differ compared with those quantified by the video-based analysis software due to differences in image resolution and digitizing accuracy process).