 |
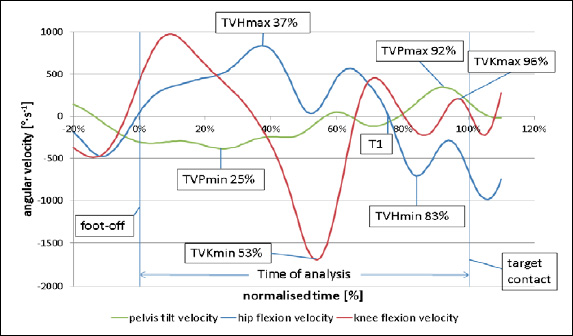
Figure 3.
Diagram of pelvis, hip and knee angular velocities and temporal parameters TVPmin/max, TVHmax/min, TVKmin/max and T1. This technique shows a proximal-to-distal sequencing characteristic for the leg raising period (TVPmin < TVHmax < TVKmin < T1) but no such pattern for the leg lowering period (T1 < TVHmin < TVPmax < TVKmax).