 |
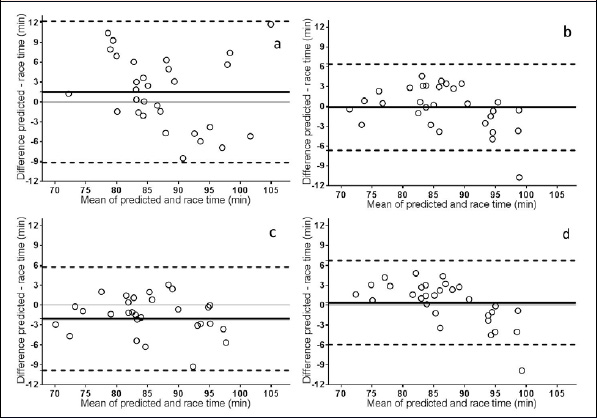
Figure 2.
Bland-Altman plots comparing the predicted time and the race time for the runners of the Phase 2 (n= 30): Equation 1 (a), Equation 2 (b), Equation 3 (c) and Equation 4 (2). The short-dashed lines represent the upper and lower 95% limits of agreement, whereas the solid line represents the bias.