 |
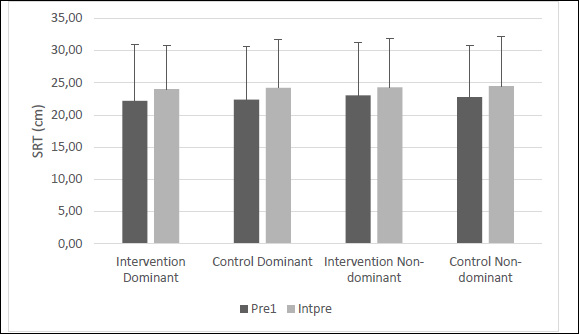
Figure 5.
Figure illustrates means and standard deviations of the two sit-and-reach pre-tests (Pre1 and Intpre). Horizontal line indicates there was a main effect for time with an overall increase in sit and reach performance from pre1 to Intpre.