 |
Figure 4.
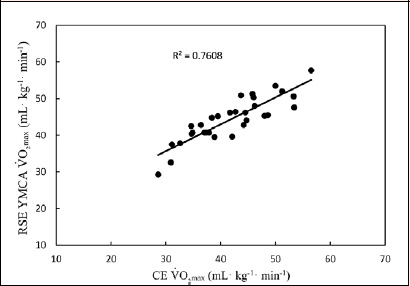
CE measured V̇O2 max versus RSE YMCA estimated V̇O2 max. Pearson correlation is represented.
|
|
|
Figure 4.
CE measured V̇O2 max versus RSE YMCA estimated V̇O2 max. Pearson correlation is represented.
|