 |
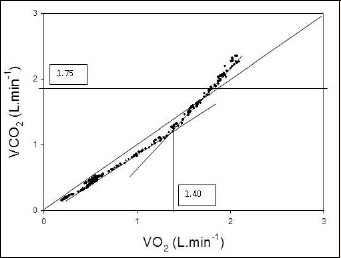
Figure 1.
The carbon dioxide output (V̇CO2) versus oxygen uptake (V̇O2) relationship. The metabolic threshold (V̇O2θ¸) is identified at the point at which V̇CO2 increases out of proportion to the increase in V̇O2. V̇O2θ¸ is identified on the x-axis at a value of 1.40 L/min. The horizontal line at V̇CO2 = 1.75 L/min represents the ventilatory threshold (V̇CO2θ¸) as determined in Figure 2. The line of identify intersects the origin of the x- and y-axes.