 |
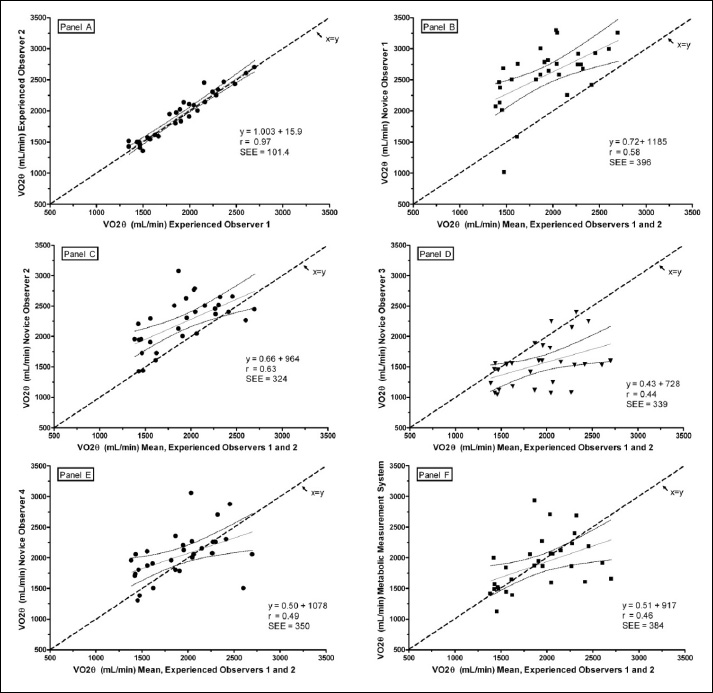
Figure 4.
Linear regressions of V̇O2θ¸ selected by pairs of interpreters. Data points are means of triplicate trials. The diagonal dashed line represents the line of identity (x = y); the solid diagonal line is the regression line; 95% confidence limits are shown by the curved lines. Panel A shows E1 versus E2. Panels B-E show the mean V̇O2θ¸ selected by N1, N2, N3, and N4, respectively versus the mean of E1 and E2. Panel F is the regression of the mean V̇O2θ¸ selected by auto-detection by the metabolic measurement system (MC) versus the mean of E1 and E2.