 |
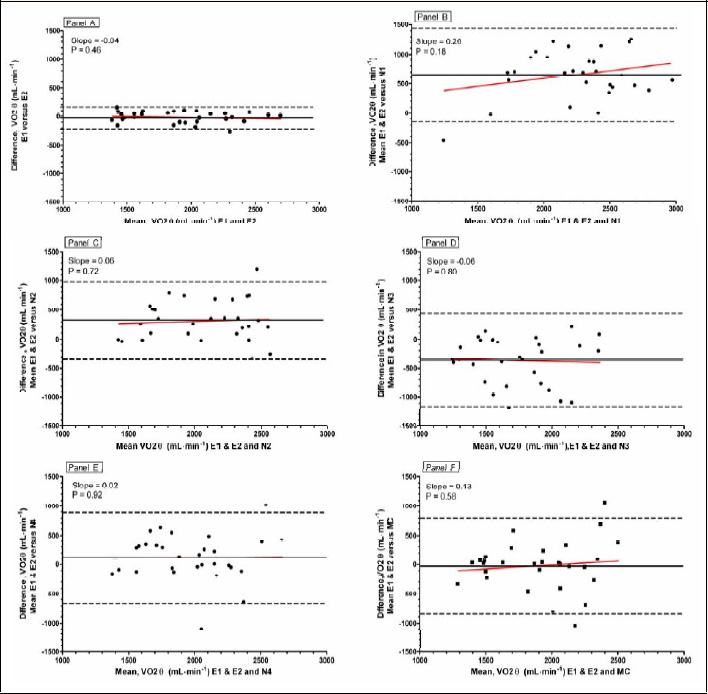
Figure 5.
Bland-Altman plots of the difference between the selections of V̇O2θ¸ by pairs of interpreters versus the mean of their selections. The solid horizontal line represents the mean bias between the pairs of interpreters; the two dashed lines represent the 95% confidence limits of the bias. Each data point is the average of three trials for the ten subjects. Panel A shows E1 vs E2; Panels B-E show the mean of E1 and E2 selections of V̇O2θ¸ versus those of N1-N4; Panel F shows the mean of E1 and E2 selections versus the MC automated selection of V̇O2θ¸.