 |
Figure 3.
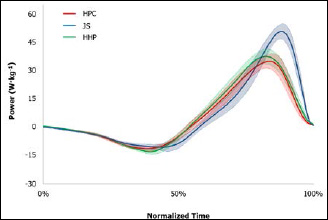
Normalized re-sampled power-time curves of the HPC, JS, and HHP performed at 65% 1RM HPC. Note: shaded areas represent 95% upper and lower confidence limits.
|
|
|
Figure 3.
Normalized re-sampled power-time curves of the HPC, JS, and HHP performed at 65% 1RM HPC. Note: shaded areas represent 95% upper and lower confidence limits.
|