 |
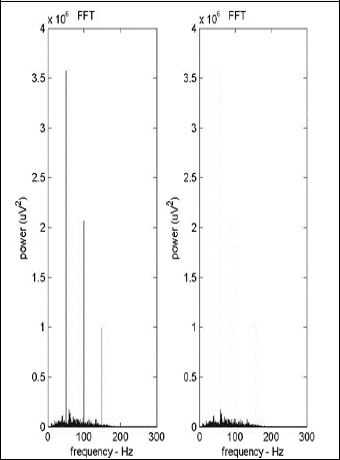
Figure 4.
Example of the EMG spectrogram of the vastus lateralis muscle during the WBV exercise protocol in the 50 Hz group. Condition at LEFT represents the signal without removal of the vibration-induced motion artefacts. Condition at RIGHT shows the EMG frequency spectrum after filtering out the sharp peaks of the signal.