 |
Figure 2.
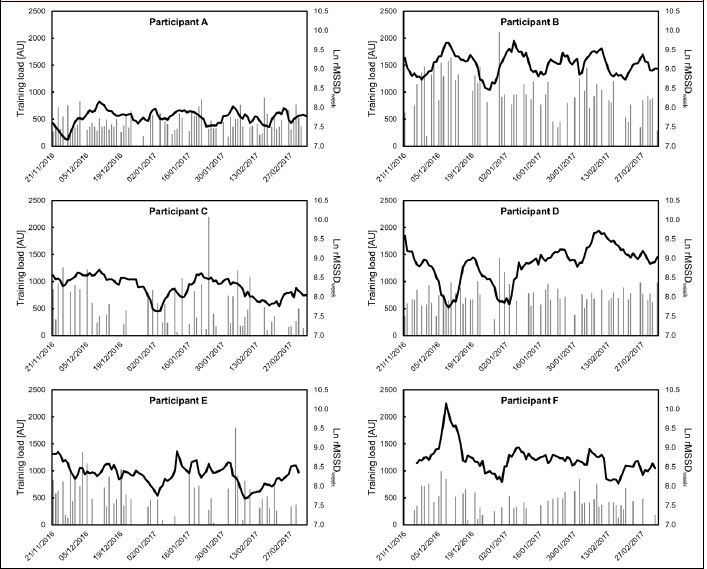
Daily sRPE training load values (grey bars) and Ln rMSSD 7-day rolling average (black line) for each athlete across the 16 week study period.
|
|
|
Figure 2.
Daily sRPE training load values (grey bars) and Ln rMSSD 7-day rolling average (black line) for each athlete across the 16 week study period.
|