 |
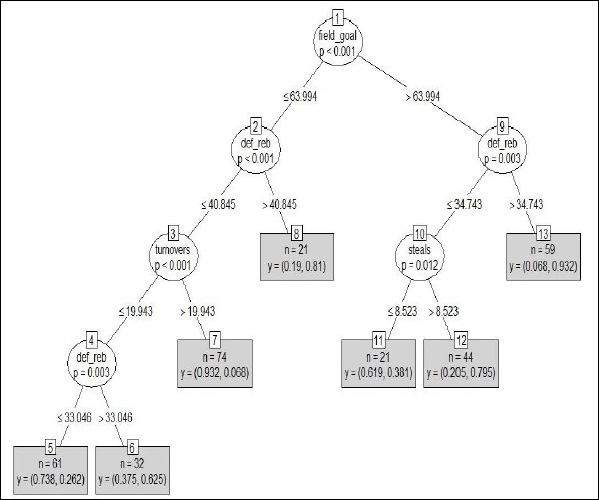
Figure 1.
The conditional interference classification tree showing the probability of wins and losses during Olympic men’s basketball tournaments. Note: “n” denotes the number of observations in each node (minimum of 10). The first y value denotes the probability of losing and the second y value denotes the probability of winning (e.g. 0.8 = 80%). field_goal = ‘field-goal percentage’, def_reb = ‘defensive rebounds’; values for each team performance indicators were normalized to ball possessions.