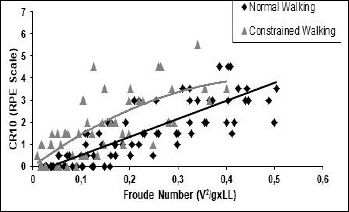
Figure 1.
Mean data graph displaying CR10 (RPE) in relation to Fr in normal and constrained walking.