 |
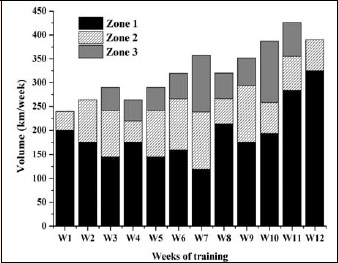
Figure 1.
Training intensity distribution for each twelve week of training. The bars indicate the volume swam in each intensity’s zones. The filled bars indicate the volume at low intensity (zone 1); the dashed bars indicate the volume at medium intensity (zone 2); the filled gray bars indicate the volume at high intensity (zone 3).