 |
Figure 2.
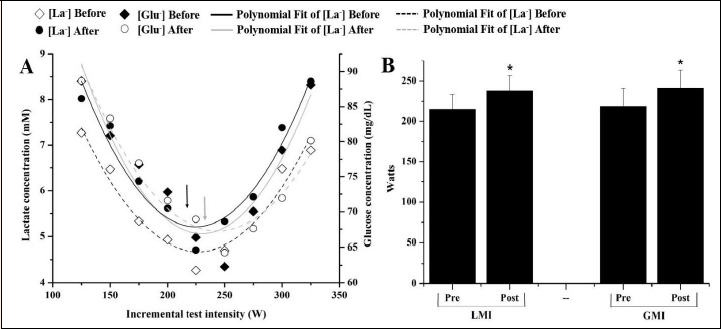
A) Expected behavior of the lactate and glucose minimum curves before and after a endurance training period and; B) Effect of training in GMI and LMI work load (W). *significantly different from pre (p < 0.05).
|
|
|
Figure 2.
A) Expected behavior of the lactate and glucose minimum curves before and after a endurance training period and; B) Effect of training in GMI and LMI work load (W). *significantly different from pre (p < 0.05).
|